


Stock Technical Screener Pro is an app for technical analyze stocks markets. We use filter stock based on Descriptive, Fundamental and Technical.
- There are a variety of technical indicators that you can use for filter stock, with our app, everything becomes easier. We based on Finviz for separate stock into some category,
Moreover, this app is not only USA market but also include other countries: Asia, Europe, Latin America, Singapore, ……….. You can use this future in Descriptive Screen and choose Country.
- This app supports multiple filters, you can combine them for getting the most appropriate Stock for yourself :)
1. Descriptive:
You can filter by some criteria: Exchange(Any, AMEX, NASDAQ, NYSE) , Index (S&P 500, DJIA) , Sector ( Financial, Healthcare, Services, Technology), Industry, Market Cap ( Mega, Large, Mid, Small, Micro), Dividend Yield, Price ( Under $1 to $100, many options),
2. Fundamental:
We have some choices for you: PE(Low, Profitable, High) , Forward P/E, PEG, P/S, Price/Cash/ Return on Equity. It is very helpful for you
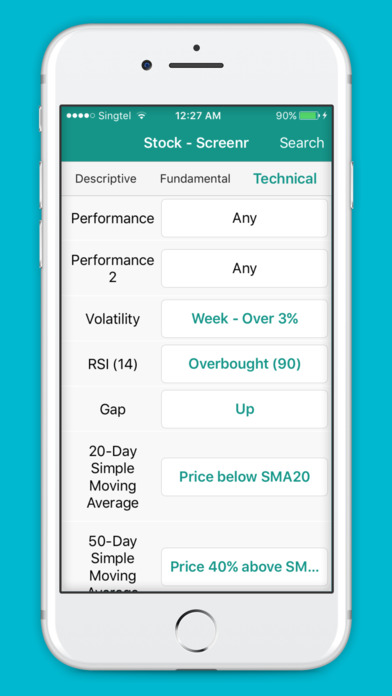
3. Technical:
There are many indicators that you can use for scanning stocks. Below is a list of the most popular stock chart patterns that you can use with our Stock Technical Screener app:
- RSI14 (oversold 90 80 70 60)
- Gap (from Up 0% to Up 20%),
- 20-Day Simple Moving Average ( Price below SMA20, Price 10% to 50% below SMA20)
- 50-Day Simple Moving Average,
- 200-Day Simple Moving Average
- 20-Day High/Low, 50-Day High/Low
- 52-Week High/Low ( 0 -> 100$ above Low),
- Average True Range ( Over 0.25 -> 5, Under 0.25 -> 5).
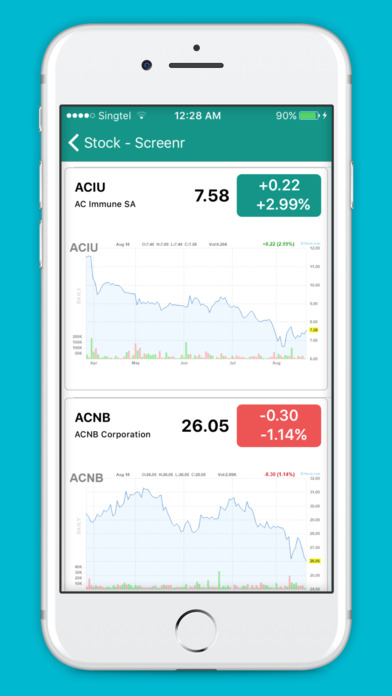
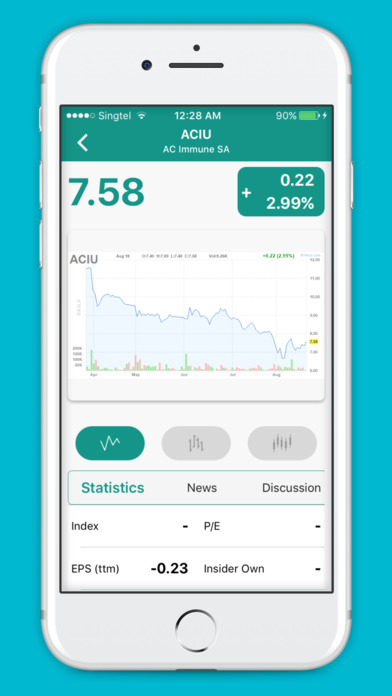
For each stock, we show some important detail content for it:
- Statistics ( P/E, Insider Own, Perf Week, Forward P/E, Income, Sales, ………
- Some updated news. We get from trusted source: Finviz
- We have discussion section, with golden advice from stock tweet, they are very helpful to find more information
- Upgrade – Downgrade
- Insider Trades: we show the date, name, value, cost, shares, shares total. It provides some important information to help your decision.
- Type of chart: Line Chart, Candle Stick, OHLC chart.